Traffic
Know where your traffic comes from
Pick a range, read the headline numbers against the period before it, then split the total until you find the part that moved.
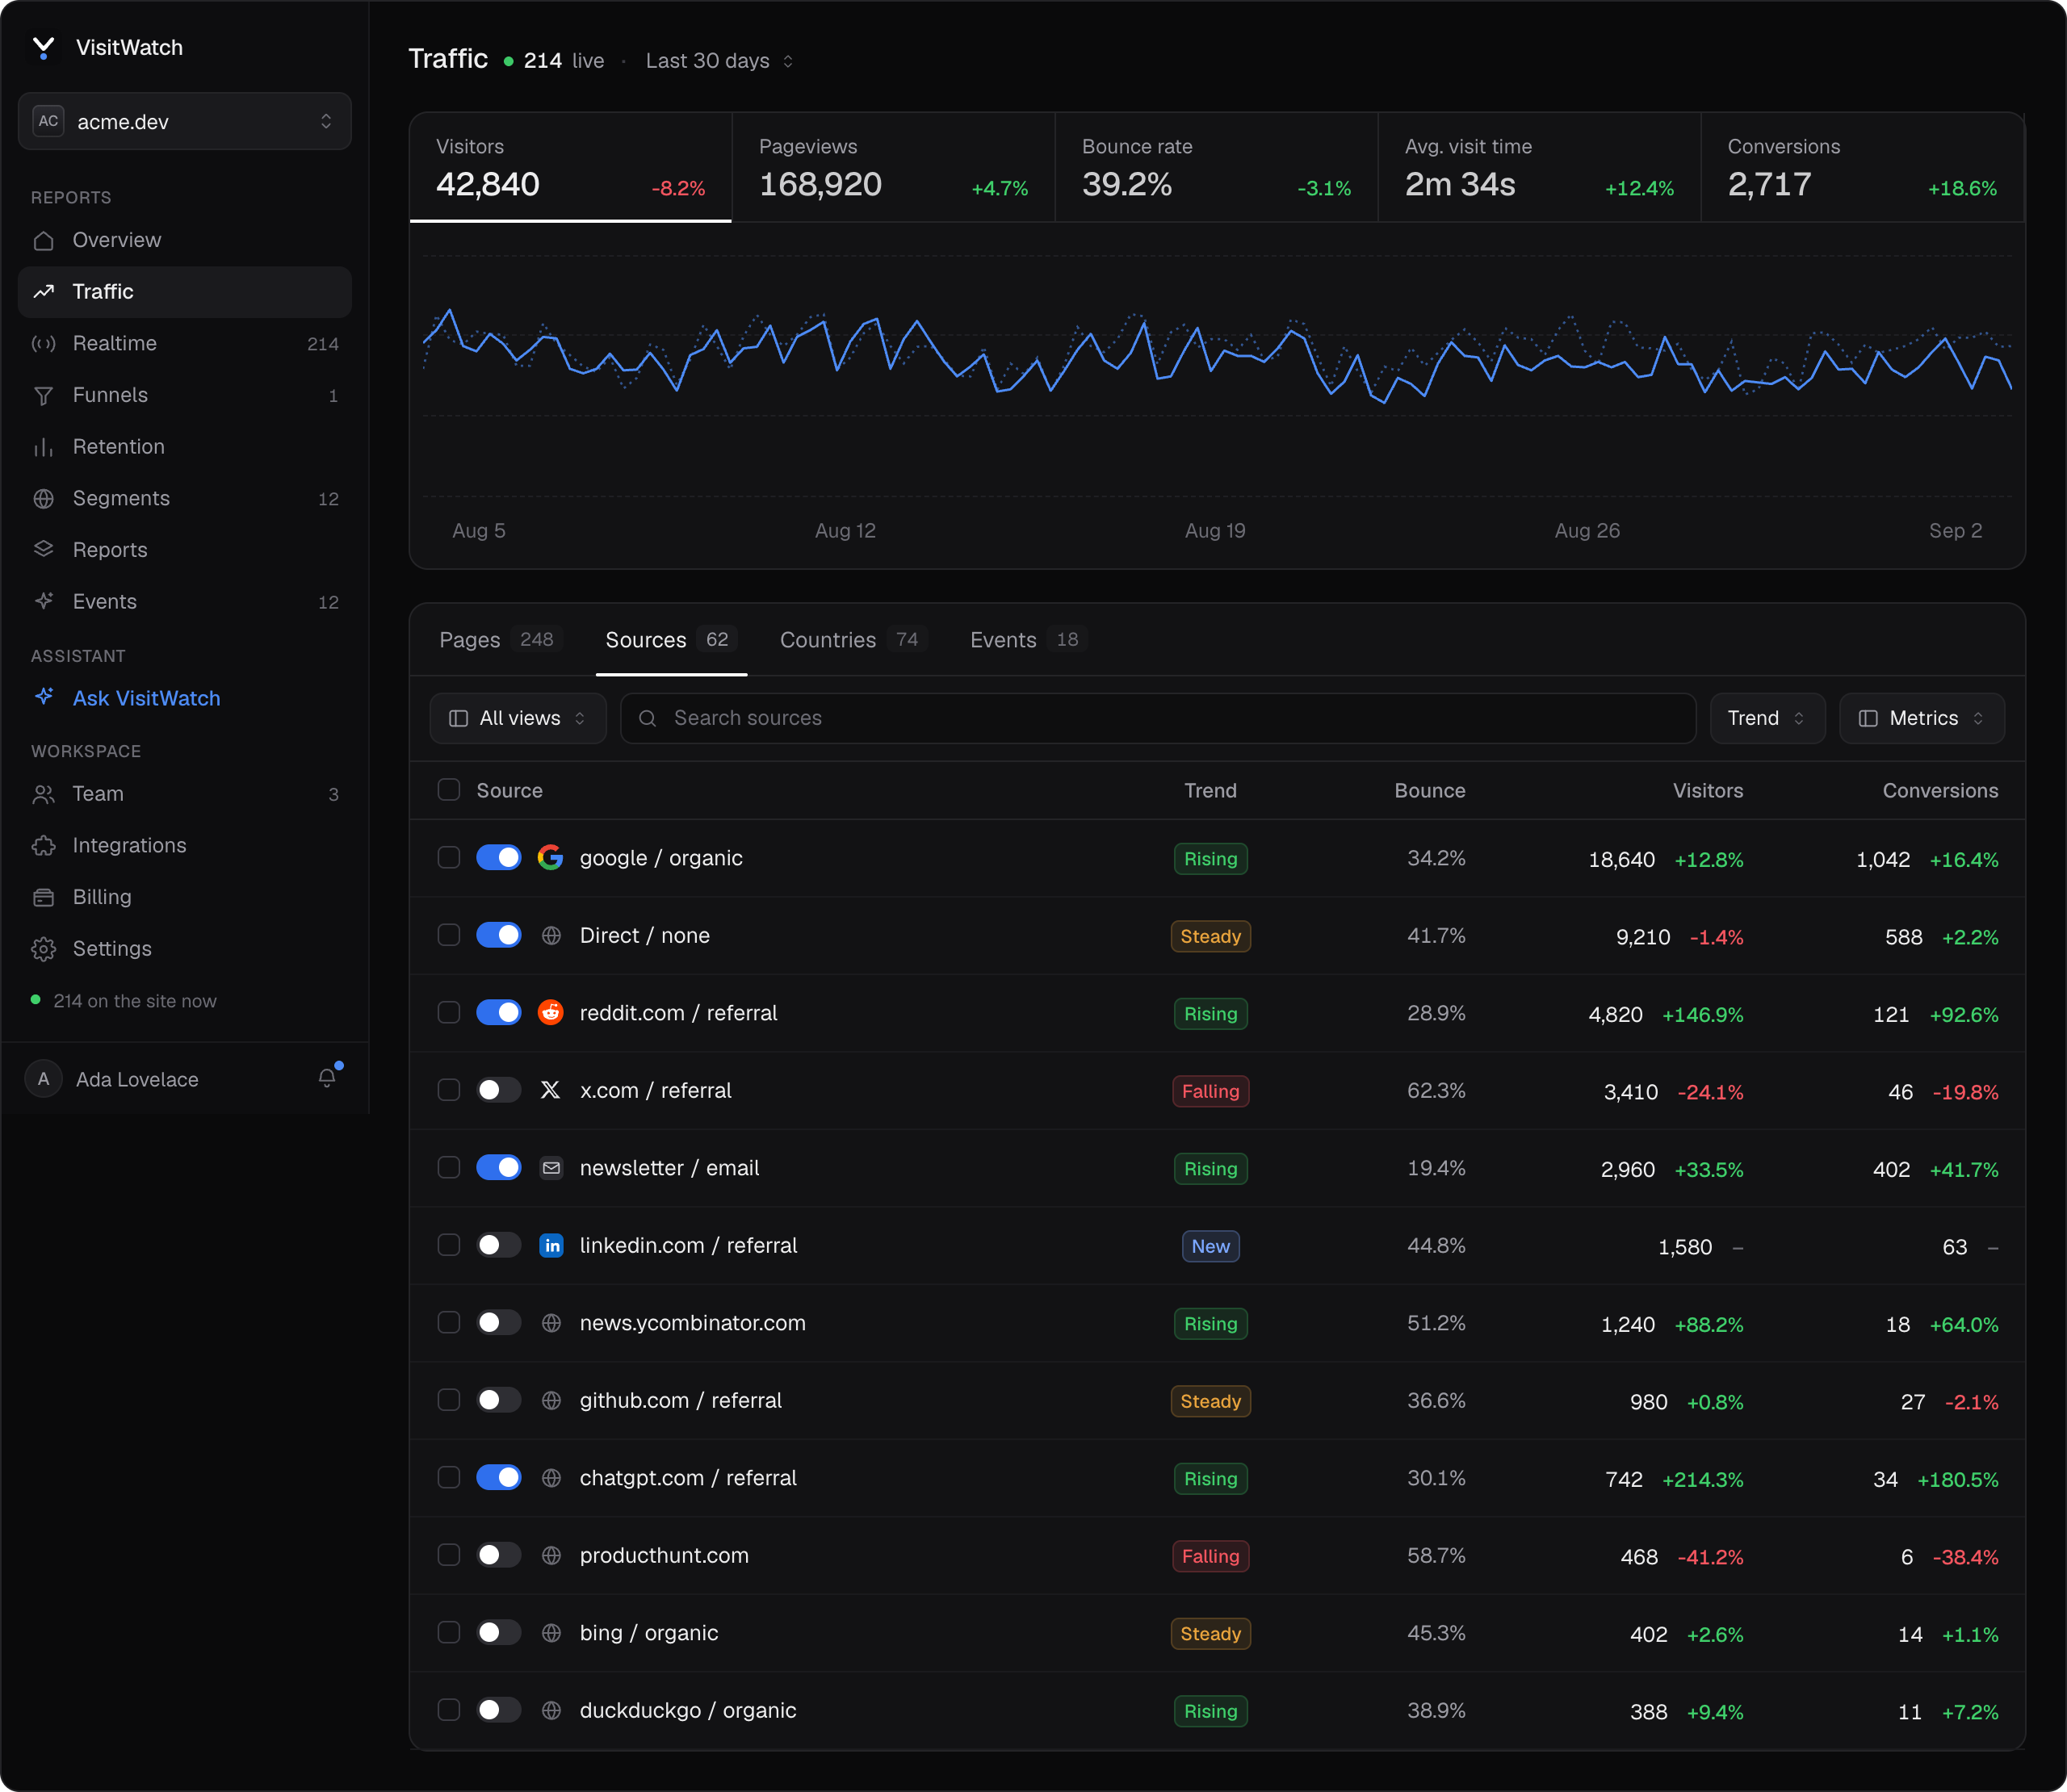
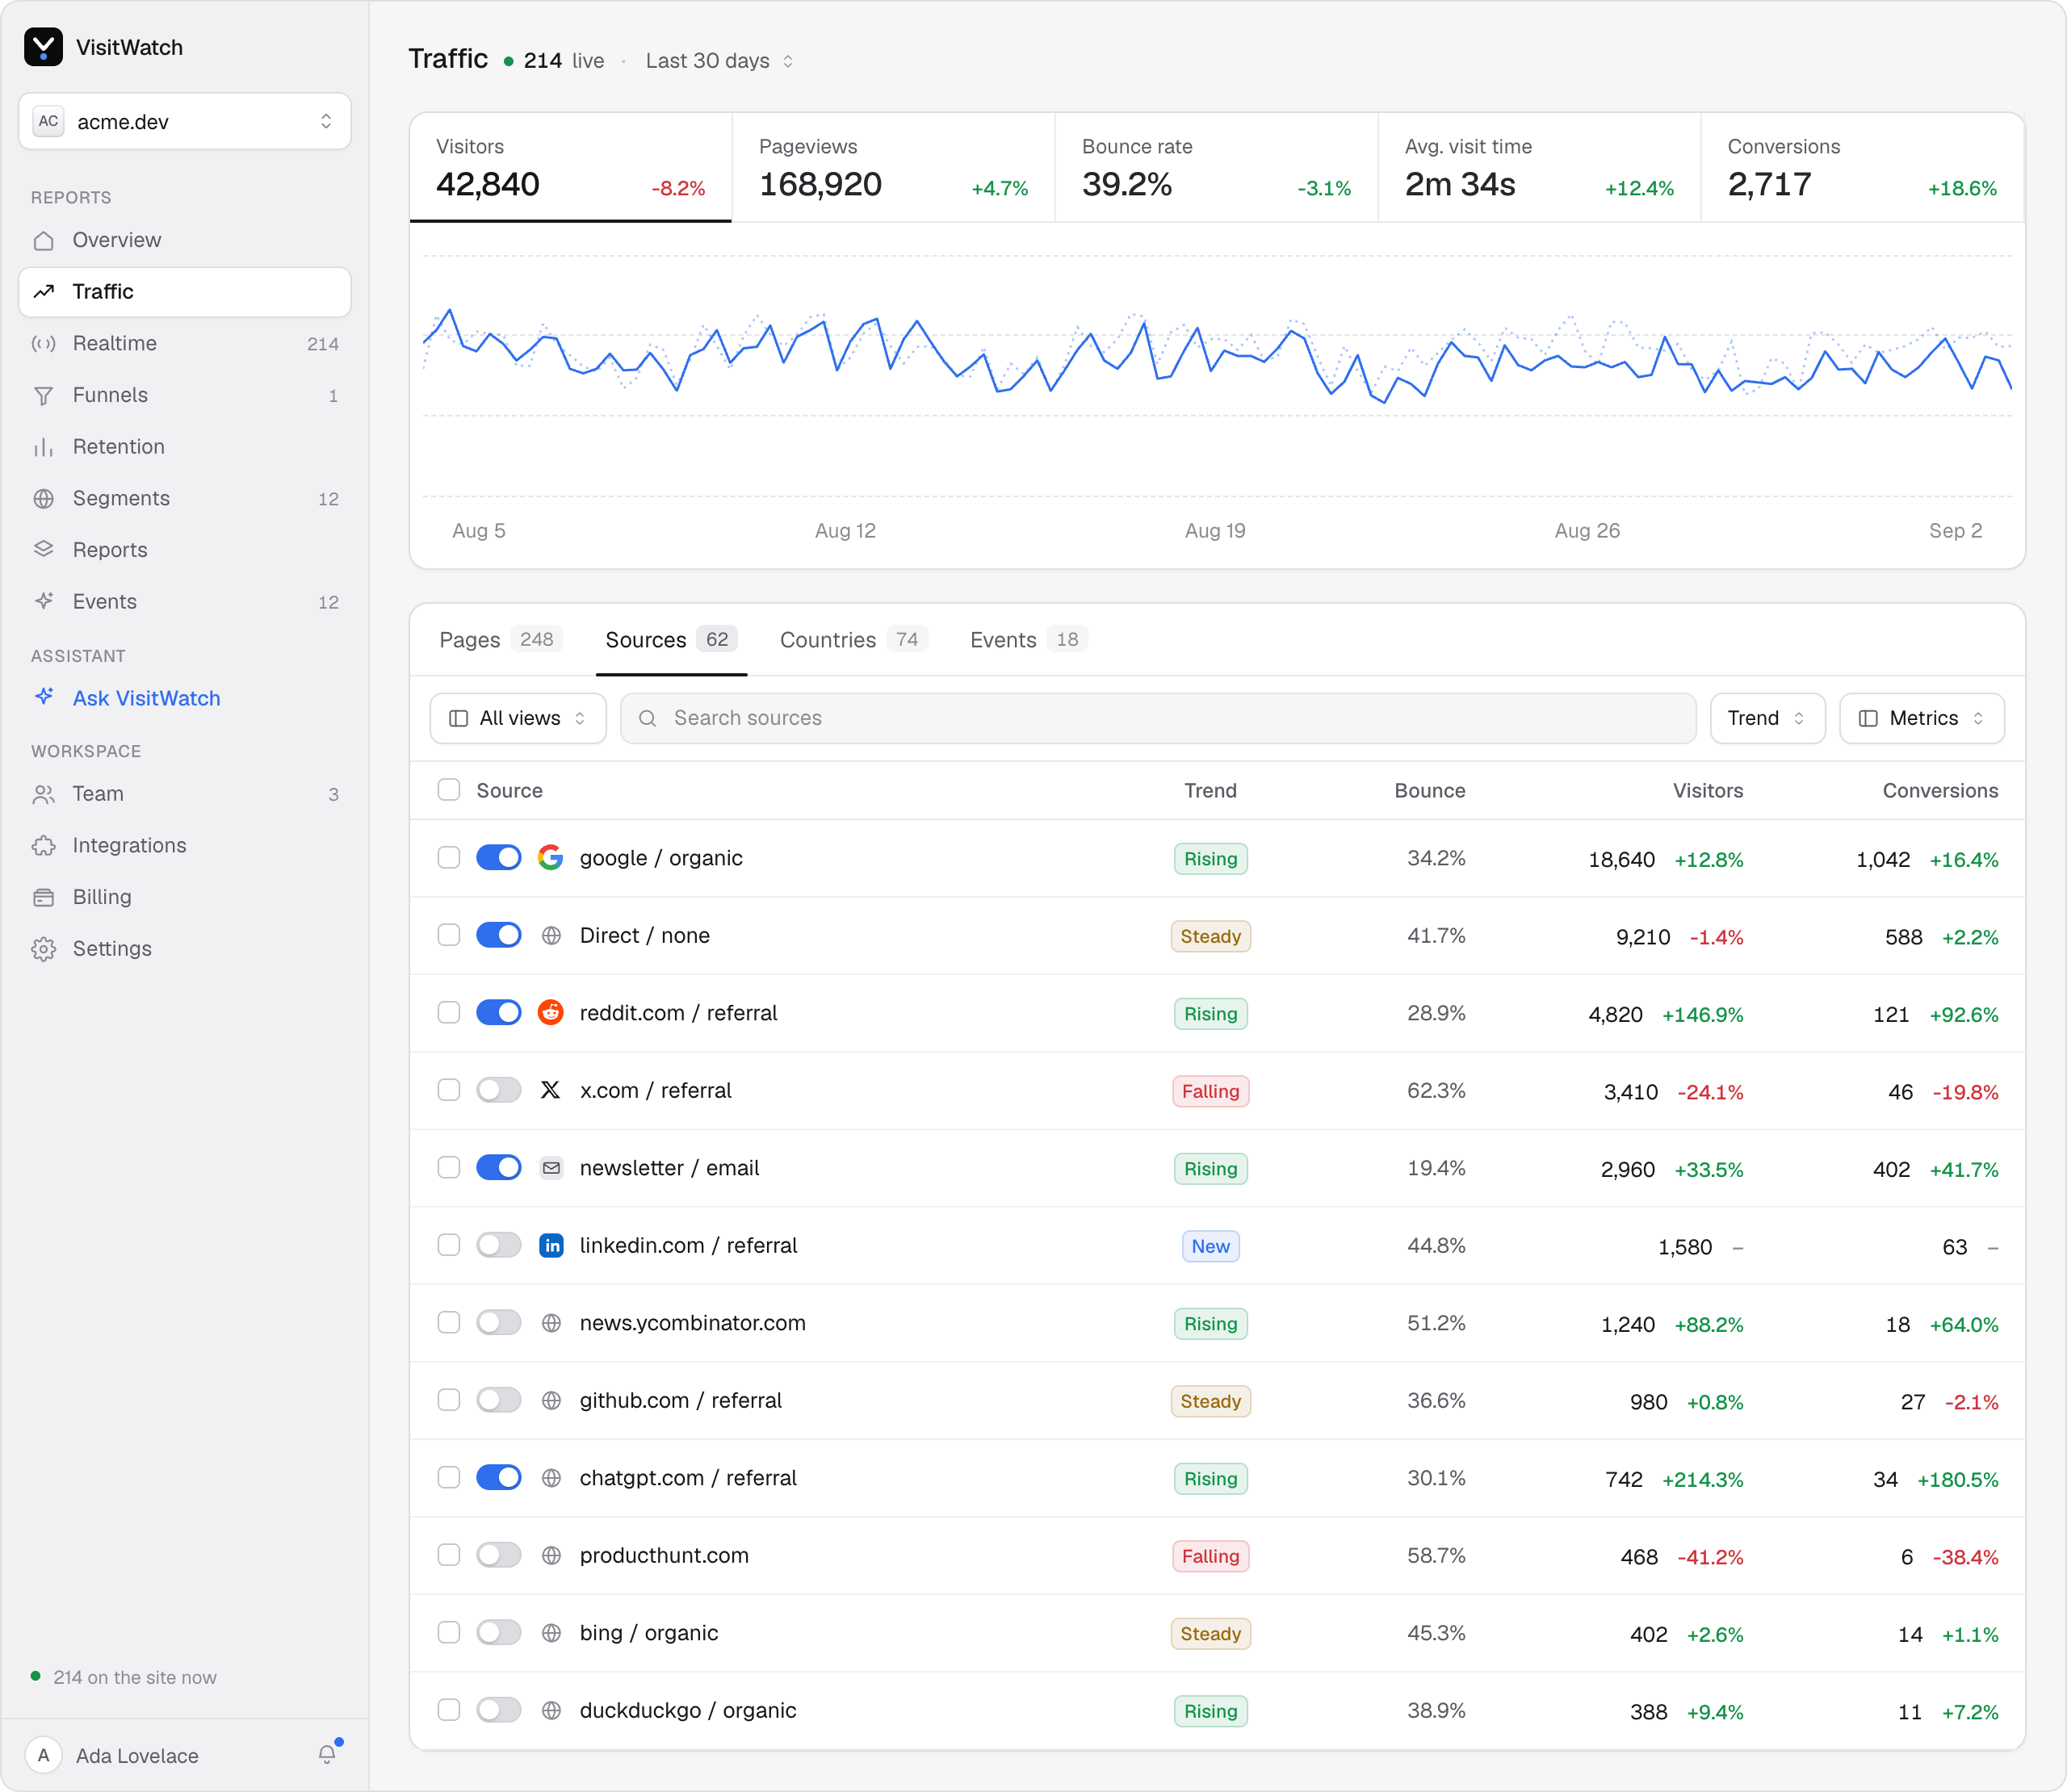
Visitors, pageviews, bounce rate, average visit and conversions, each against the previous period.
01
Split the total until you find the part that moved
A total that fell tells you nothing about what to do. The same range broken down by page, source, campaign, country or device usually names the cause in one step: a high visitor count with a short visit is a different problem from a low count with a long one, and a fall concentrated in one referrer is a different problem from a fall spread across organic search.
- /+9.8%
- /pricing+22.4%
- /docs/quickstart+4.1%
- /blog/tracking-without-cookies+61.7%
- /signup+15.2%
02
Campaigns stay out of your organic numbers
UTM parameters are read into their own report rather than folded into the referrer that carried them, so a newsletter send is never mixed in with organic arrivals from the same domain. The same campaign running on two channels stays two rows, because it almost always performs differently on each.
- spring-launch · email512 · 9.2%
- spring-launch · social384 · 1.1%
- docs-refresh · email300 · 6.7%
- pricing-test · social176 · 3.4%
03
Every number carries the period before it
Comparison is not an option you switch on. Each metric and each row is reported against the previous period of the same length, so a good week is visible without exporting anything. Switch the comparison to the same period last year when your traffic is seasonal and a Christmas peak stops looking like a collapse in January. Ranges run from the last 24 hours to the last 12 months, or a custom range when you need to match a campaign window exactly.
- google / organic+14.2%
- Direct / none-1.2%
- reddit.com / referral+96.4%
- x.com / referral-18.3%
When the traffic report is describing itself, not your site
A fall spread evenly across every source starting on the same day is usually tracking rather than traffic — check the live feed before rewriting anything. Country is approximate: it is derived from the request and then discarded, so it is a distribution rather than a fact about any one visitor. And bounce rate is a property of the page pair, not of the reader: a single-page answer that worked reads exactly like a page nobody wanted.
Questions about traffic
These are on the guides index too, alongside every other question the site answers.
How do I check how much traffic my website gets?
Add the tracking script and read the visitor count for a date range. Visitors, pageviews, bounce rate, average visit and conversions are shown together, each with the change against the previous period of the same length.
Why did my traffic drop?
Compare against the previous period and look at sources rather than the total. A fall concentrated in one referrer usually means a link cooled off. A fall across organic search points at rankings or seasonality. A fall spread evenly across every source on the same day usually means tracking, not traffic.
Are campaigns separated from organic referrals?
Yes. UTM parameters are read into their own campaign report, so a newsletter link is not mixed in with organic arrivals from the same domain.
Related
See your own traffic
Add the script, pick a range, and every number arrives with the period before it already beside it.
14-day free trial. No credit card required.